E-Commerce Supply Chain Analytics Project
An end-to-end analytics engineering system transforming raw operational data into executive-level business intelligence using dbt, Microsoft Fabric, and Machine Learning.
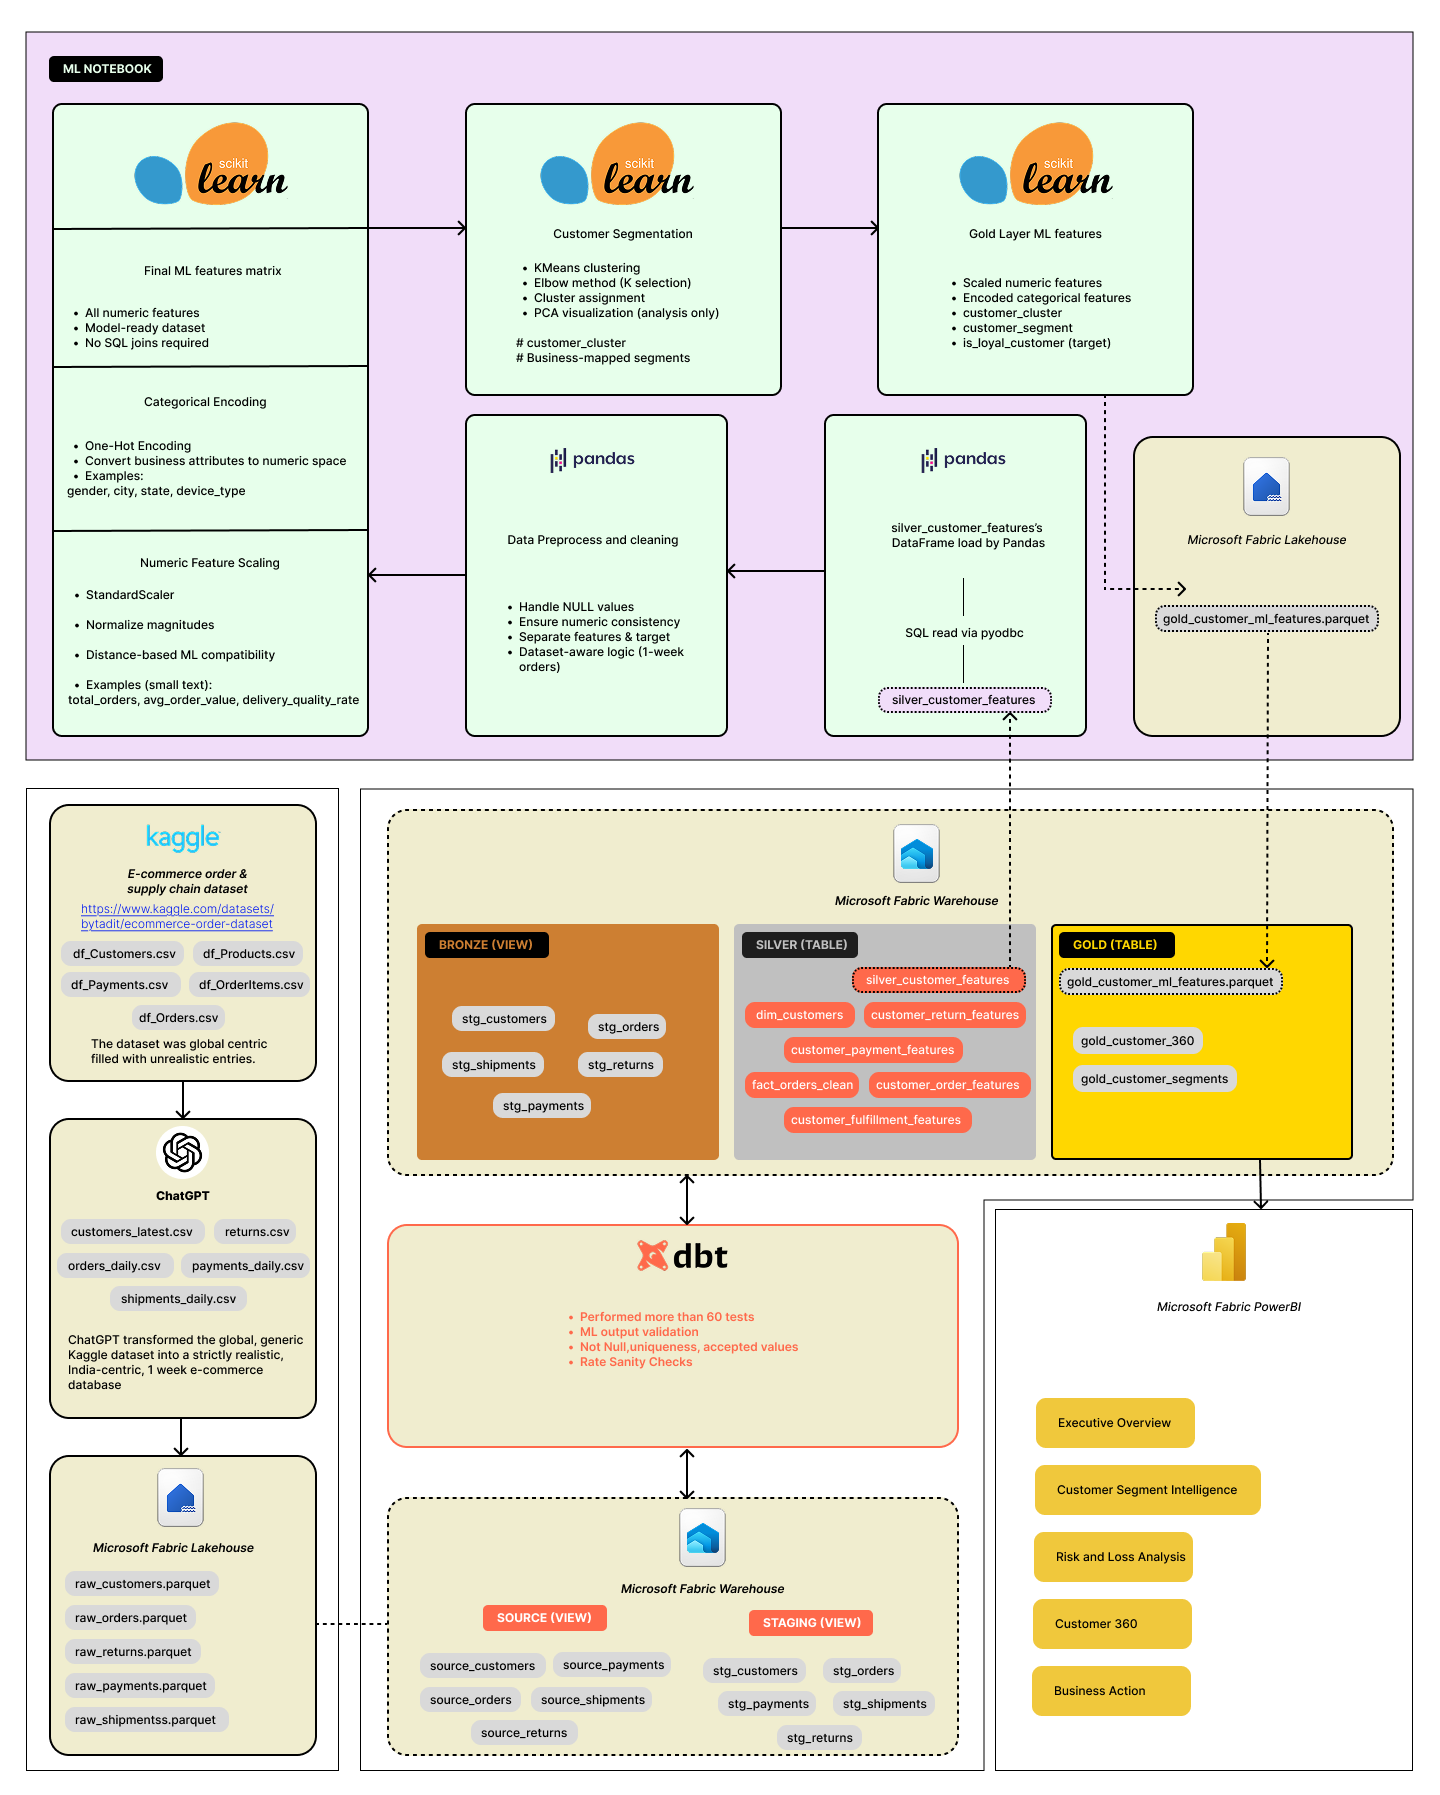
Project Pipeline
The Challenge
Transforming Chaos into Strategy
Supply chain data is often messy, siloed, and reactive. This project simulates a real-world enterprise environment where operational data from different sources is centralized and processed.
Fabric Warehouse
dbt Modeling
Project Scope
- Medallion Architecture: Built a robust pipeline on Microsoft Fabric.
- Feature Engineering: Derived risk metrics and customer behavior scoring.
- ML Segmentation: Applied unsupervised learning for customer risk tiering.
Project Deliverables
Business Insights
Questions Answered Through Data
Who are our most valuable customers?
The Regular Reliable Customers segment is the most valuable. Although they are not the largest group, they contribute the highest share of total revenue (~₹2.19M), have the highest order frequency, near-zero return and cancellation rates, and the best payment success rate. This makes them the safest and most profitable segment for long-term growth.
Which customers are causing operational losses?
The High Value but Return Heavy and High Risk / Cancellation Prone segments are the primary sources of loss. Despite placing multiple orders, these customers show return rates close to 100% or very high cancellation behavior. This directly leads to ₹260K+ revenue lost due to returns, as highlighted in the Risk & Loss Analysis page.
How do delivery and logistics impact customer behavior?
Delivery performance has a visible impact on customer quality. The dashboard shows that customers with average delivery times above ~3.5 days tend to have lower delivery quality scores and are more likely to fall into high-risk or return-heavy segments. Faster deliveries (around 2–2.5 days) correlate strongly with higher loyalty and lower return behavior.
Who should we retain, fix, or restrict?
Using a composite Customer Risk Score, customers were classified into clear action buckets: Retention Candidates (28) with high loyalty and low risk, Fix Candidates (23) who generate revenue but suffer from delivery or payment issues, and High Risk Customers (84) who show extreme return or cancellation behavior. This enables precise, action-oriented decisions instead of blanket policies.
Where does our revenue actually sit relative to customer risk?
The Risk vs Revenue analysis reveals that most revenue comes from low-risk customers, while high-risk customers contribute very little revenue despite consuming significant operational effort. This clearly supports a strategy of retaining low-risk customers, fixing mid-risk customers, and restricting high-risk customers to protect margins.